It is used to learn concepts that I do not understand very well about research design.
Correlational Research Design
Phrase
Refers to a non-experimental research method which studies the relationship between two variables with the help of statistical analysis.
Example: You want to know if wealthy people are less likely to be patient. From your experience, you believe that wealthy people are impatient. However, you want to establish a statistical pattern that proves or disproves your belief. In this case, you can carry out correlational research to identify a trend that links both variables.
en: Se refiere a un método de investigación no experimental que estudia la relación entre dos variables con la ayuda de análisis estadístico.
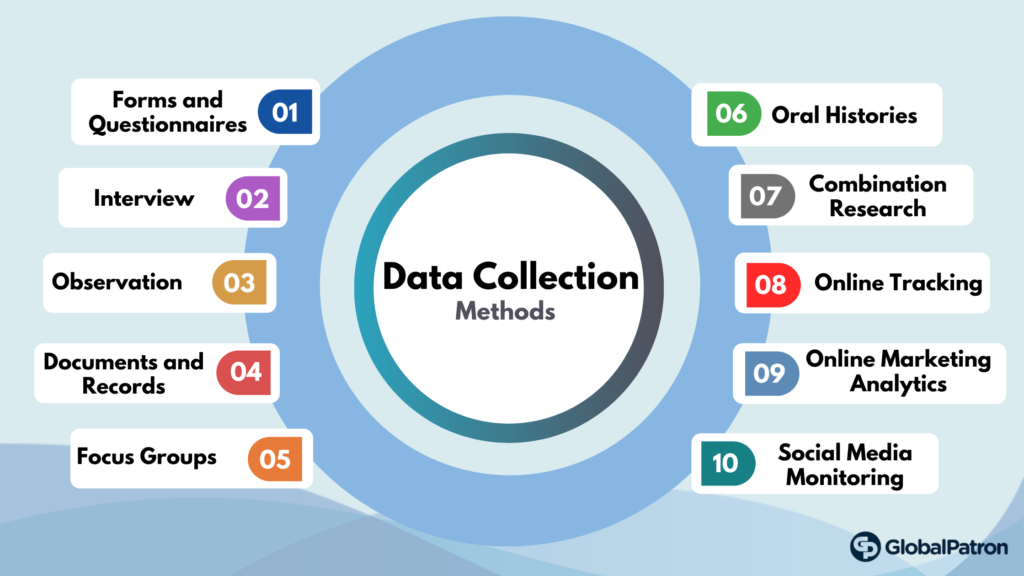
Data Collection
Phrase
Is the process of gathering and measuring information on variables of interest, in an established systematic fashion that enables one to answer stated research questions, test hypotheses, and evaluate outcomes.
Example: Here are the top six data collection methods:
. Interviews
- Questionnaires and surveys
- Observations
- Documents and records
- Focus groups
- Oral histories
en: Es el proceso de recopilar y medir información sobre variables de interés, de una manera sistemática establecida que le permite a uno responder preguntas de investigación planteadas, probar hipótesis y evaluar resultados.
Experimental Research
Phrase
Is research conducted with a scientific approach using two sets of variables. The first set acts as a constant, which you use to measure the differences of the second set.
Example: Administering Exams After The End of Semester
During the semester, students in a class are lectured on particular courses and an exam is administered at the end of the semester. In this case, the students are the subjects or dependent variables while the lectures are the independent variables treated on the subjects.
Only one group of carefully selected subjects are considered in this research, making it a pre-experimental research design example. We will also notice that tests are only carried out at the end of the semester, and not at the beginning.
Further making it easy for us to conclude that it is a one-shot case study research.
en: Es una investigación realizada con un enfoque científico utilizando dos conjuntos de variables. El primer conjunto actúa como una constante, que se usa para medir las diferencias del segundo conjunto
Measurement
verb
Is the quantification of attributes of an object or event, which can be used to compare with other objects or events.
Example: How satisfied are you with our services?
- Very Unsatisfied – 1
- Unsatisfied – 2
- Neutral – 3
- Satisfied – 4
-Very Satisfied – 5
en: Es la cuantificación de atributos de un objeto o evento, que se puede utilizar para comparar con otros objetos o eventos.
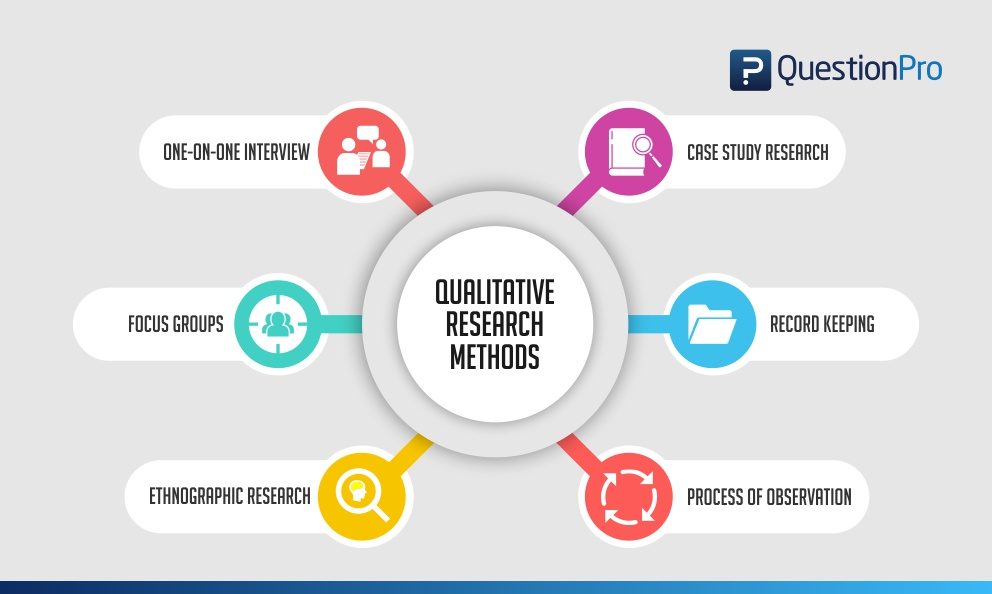
Qualitative Research
Phrase
Is a process of naturalistic inquiry that seeks an in-depth understanding of social phenomena within their natural setting.
Example: For example, on successfully interviewing female customers, visiting the nearby stores and malls, and selecting them through random sampling, it was known that the store doesn’t have enough items for women and so there were fewer women visiting the store, which was understood only by personally interacting with them and understanding why they didn’t visit the store, because there were more male products than female ones.
en: Es un proceso de investigación naturalista que busca una comprensión profunda de los fenómenos sociales dentro de su entorno natural.
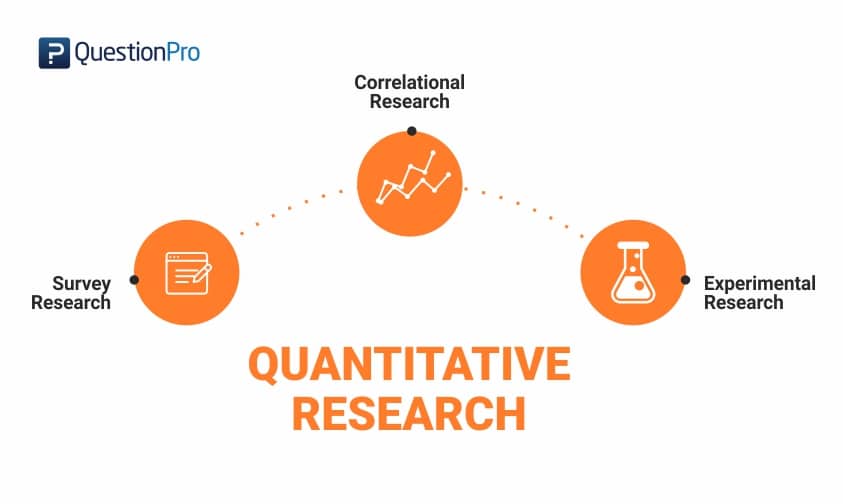
Quantitative Research
Phrase
Is referred to as the process of collecting as well as analyzing numerical data. It is generally used to find patterns, averages, predictions, as well as cause-effect relationships between the variables being studied.
Example: An example of quantitative research is the survey conducted to understand the amount of time a doctor takes to tend to a patient when the patient walks into the hospital. A patient satisfaction survey template can be administered to ask questions like how much time did a doctor takes to see a patient, how often does a patient walks into a hospital, and other such questions.
en: Se conoce como el proceso de recopilación y análisis de datos numéricos. Generalmente se utiliza para encontrar patrones, promedios, predicciones, así como relaciones de causa-efecto entre las variables que se estudian.
Reliability
Adjective
is the overall consistency of a measure. A measure is said to have a high reliability if it produces similar results under consistent conditions.
Example: - We aim to further improve the reliability of the electric power grid.
- Some experts have questioned the reliability of the test.
- There are issues with punctuality and reliability of bus services across the region.
en: Es la coherencia global de una medida. [1] Se dice que una medida tiene una alta confiabilidad si produce resultados similares en condiciones consistentes.
Research Design
Phrase
Is the framework of research methods and techniques chosen by a researcher.
Example: Back to Research Design
The research design addresses the pressing problem of providing leadership in K-12 schools in mathematics education. Professional learning opportunities in mathematics content and pedagogy are essential to support teachers as they encounter increased expectations for mathematics gains in their student achievement across increasingly diverse student bodies. The designers of this project also include the need for teacher leaders to apply their learning at their school and district site and engage in a continuous process of praxis, using theory to inform practice and practice to inform their knowledge as intellectual leaders. In order to investigate the development and enactment of the institute, as well as the effects of teacher learning on their schools and students, a mixed-methodology (Cresswell, 2003, Tashakkori & Teddlie, 2003) will be used for this study. This design supports the collection and analysis of quantitative and qualitative data related to teacher leader learning of mathematics, pedagogy, and leadership during their participation in the Institute. Data will also be collected in relationship to the effects of teacher leader participation on their students’ achievement and the development of standards-based learning environments in their classrooms. A mixed effects statistical model will be used to relate elements of teacher professional learning (math content and enhanced pedagogy) to student achievement, and to classroom learning environments.
The study addresses two overarching questions:
1. What are Teacher Leaders learning from participation in the Institute and how are they learning it?
2. What effects does this learning have on student achievement, classroom environments, and professional work with colleagues and administrators?
Qualitative approaches will be particularly valuable in exploring the developing role of teacher leaders in action, while quantitative methods can determine whether the Institute is a value-added approach for addressing the ultimate national priority of stronger mathematics students. The members of the research team add greatly to the proposed methodology since they have engaged from different perspectives in studying teachers’ and students’ learning of mathematics for many years and include mathematicians, qualitative researchers, a school researcher, and quantitative researchers who have developed a mixed effects linear hierarchical model for relating elements of professional development to student achievement. The following table lists the sub-questions to be answered under each overarching question for the research study. Fuller descriptions of when data will be collected, by whom, as well as information on instruments are included in the supplemental documents.
Research Questions and Data Collection & Analysis Summary
What are teachers learning in the Institute and how are they learning it?
Sub-questions Data Collection and Analysis
Does the presentation of mathematics using a vertical alignment model help participants gain conceptual knowledge of K-12 mathematics? Pre and Post testing annually on Mathematics Knowledge for Teaching (MKT, University of Michigan).
M-TASK– Mathematics Teacher Assessment of Skills and Knowledge-
Quantitative analysis of MKT gains. Quantitative and Qualitative analysis over two years of Institute participation
How does learning K-12 mathematics via vertical alignment help Teacher Leader candidates to differentiate instruction in the classroom? Classroom observations using validated instruments including the Levels of Use (LOU)- level of classroom implementation of PD, , Observation tool for math learning of ELL students, and the Classroom Snapshot which looks at types and structure of teaching and types of student learning (engagement, etc.) –Quantitative analysis using mixed effects model.
What features of the professional development structures (institute, school-based mentoring, PLC) help TL move towards Standards Based Learning Environment (SBLE)? Reflective questions are answered twice a semester for each PD structure; teachers also analyze their classroom in relation to the SBLE rubric and reflect on connections between the type of PD structure and how they see their classroom changing.
Structures are classes, collaborative groups, individual work
How do TL apply what they have learned in the Institute in their work with teachers and principals in their schools and districts? TLs will keep weekly field logs related to their study and its application to field using carefully guided questions as well field notes. They will also reflect on their learning at the beginning, middle, and end of each session and provide feedback on what courses and parts of courses were most valuable.
Qualitative analysis using constant-comparative method/themes.
What do TLs say were the most valuable aspects of the academy in helping their work in the schools? Teacher interviews and focus groups
Qualitative analysis using constant-comparative method for the development of themes.
What aspects of the project activities facilitate TL in applying adult learning and facilitating meaningful math discourse with PLC? Use of video and audio case studies.
Rubric on Secondary Learning Communities
Participant checking; qualitative analysis for themes
What is the effect of Teacher Leader learning on student achievement, classroom practice and the development of a district plan for improving math teaching and learning:
Does participation in the Institute positively affect student achievement? Which elements of institute learning (mathematics, pedagogy, and/or leadership) have the strongest effect on student achievement? Use of a mixed effects linear model that looks at the effect of 1) mathematics learning (MKT and M-TASK), pedagogy (Institute assessments of pedagogy abilities and SBLE-Standards-Based Classroom Rubric ) and 3) quality of time spent as part of the PLC Rubric (in development) on student achievement (state standardized test- NMSBA). Quantitative using linear hierarchical mixed-effects model.
Does participation in the Institute positively affect classroom practice? Which elements of institute learning (mathematics, pedagogy, and/or leadership) have the strongest effect on student achievement? Use of a mixed effects linear model that looks at the influence of 1) mathematics learning (MKT and M-TASK), pedagogy (Institute assessments of pedagogy abilities and SBLE) and 3) quality of time spent as part of the PLC Rubric on measurements of standards-base mathematics environments (LOUs, Classroom Snapshots). Quantitative using linear hierarchical mixed-effects model. Additional qualitative evaluation of how TLs worked.
How does participation in the Institute impact the school or district plans for improvement of mathematics instruction? District administrators and principals will be asked to assist their school’s readiness for change using the Quality Mathematics Education Model (QMEM). The QMEM will be given annually. An Improvement plan developed by the teacher leader and principal will be evaluated using a School Improvement Rubric.
Dissemination: “Our Project” researchers will disseminate their findings to the educational community through strategies that begin at the local level, and then broaden to the state, national and international level. At the national level the research findings will be submitted for publication in the Journal for Research in Mathematics Education, American Education Research Journal, or other professional journals. Practice-based articles with be submitted to journals like NCTM’s Teaching Children Mathematics and Mathematics Teaching in the Middle School. The project and its findings will be proposed for presentation at the National Council of Teachers of Mathematics (NCTM) Research Pre-session, Joint Meetings of the American Mathematics Society (AMS) and Mathematics Association of America (MAA), National Association of Bilingual Educators (NABE), American Educational Research Association (AERA), National Council of Supervisors of Mathematics (NCSM) and other national conferences. This team has presented at numerous conferences and additionally will publish a monograph to share this research project.
en: El marco de métodos y técnicas de investigación elegidos por un investigador.
Survey Research
Phrase
Is the collection of data attained by asking individuals questions either in person, on paper, by phone or online.
Example: Examples of Nominal Scale in Survey Research
How would you describe your complexion?
1-light
2-dark
3-brown
Have you used this product?
1-Yes
2-No
en: Es la recopilación de datos que se obtiene al hacer preguntas a las personas, ya sea en persona, en papel, por teléfono o en línea.
Timeline
noun
Is a list of important events arranged in the order in which they happened.
Example: In the image you can see a good example of the time line.
en: Es una lista de eventos importantes organizados en el orden en que ocurrieron.